Context
Electromagnetic Interference (EMI) is a phenomenon where electrical circuits generate RF disturbances through electromagnetic induction, electrostatic coupling, or conduction.
To comply with Electromagnetic Compatibility (EMC) regulations, various constraints and test methods have been defined, such as the CE mark in the European market (e.g. EN55022), which limit the amount of parasitic electromagnetic emission per device.
EMI can also be a serious concern for product operation, as radiating components on a PCB can cause glitches or other issues. This makes it crucial to consider EMI during the integration, validation, and debug of hardware systems.
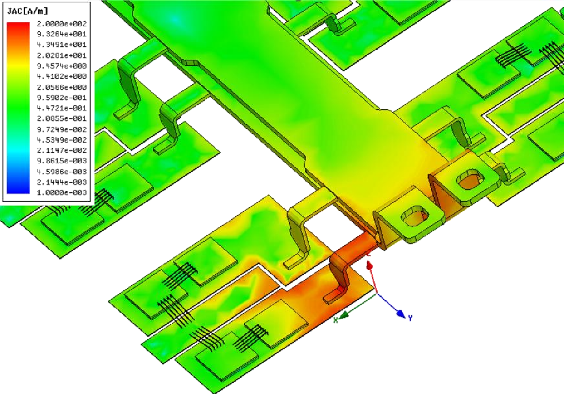 EMC simulation with ANSYS, by LEAP FEA Team, finiteelementanalysis.com
Finite element analysis EM modeling and simulation tools can be used during the design phase, but real tests require expensive equipment, a lot of physical space, and specially trained engineers or technicians.
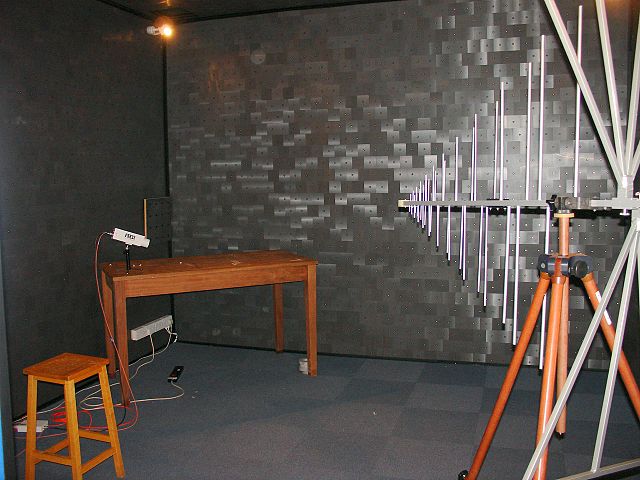 Inside of shielding room by Stan Zurek - Own work, CC BY-SA 3.0, Wikimedia
Moreover, compliance and pre-compliance testing does not provide insight into the spatial EM radiation distribution, making it unsuitable for fast prototyping, hardware iterative design, and Agile development.
To address these challenges, I developed a proof-of-concept solution that provides a simple and cost-effective system to obtain accurate 2D EMI mapping of a board or device. In this article, I explore two methods to create fast maps of the near-field EMI.
Video
The following video demonstrates the project in action.
Method #1: Using a 3D printer
One approach to obtaining accurate 2D EMI maps involves moving an H-field probe using the carriage of a 3D printer or any CNC machine while measuring the radiated power.
To implement this method, I used my DIY Skeleton 3D printer with a DIY probe mounted on a 3D printed holder.
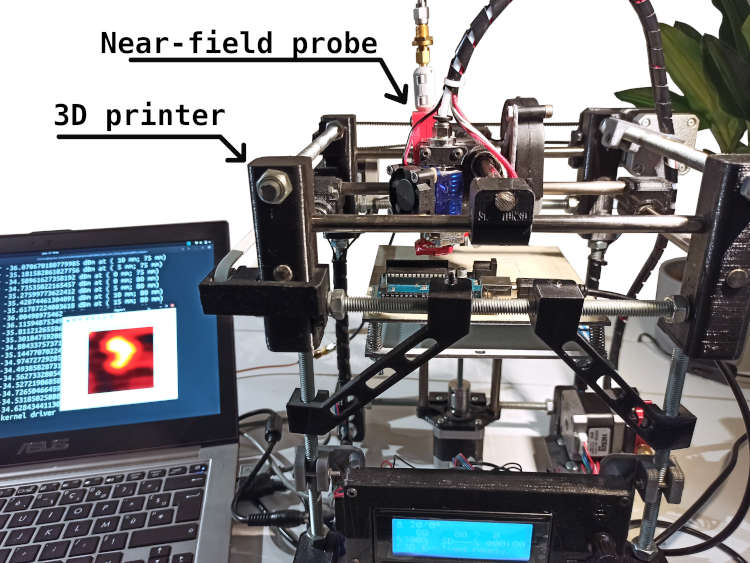
A Python script controls the printer by sending GCode commands to move the carriage while measuring the EM field with an RTL-SDR radio receiver.
There are 4 parameters that affect the speed of scan:
- The size of the zone to map,
- The resolution of the grid, which is also limited by the size of the H-field probe loop,
- The frequency span of the scan. For instance, 1GHz would take a much longer integration time.
- The printer's feed-rate, which we can tune.
Results
Here's a sample result using this method:
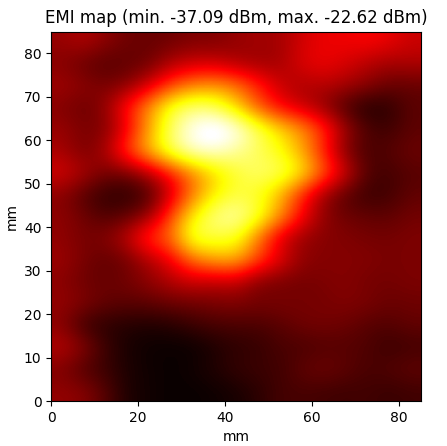 EMI scan of an Arduino Uno board with a grid resolution of 5 mm
This map shows a good view of the spatial distribution of near-field emissions, making it possible to perform broadband scans even with a narrow receiver by sweeping the center frequency.
It is possible to do broadband scans even with a narrow receiver by sweeping the center frequency.
Although this method produces accurate results, it is quite cumbersome and requires a 3D printer and mounting the probe, etc.
Method #2: Using machine vision
This method utilizes a near-field probe that is moved above the device under test, while a camera tracks its current position. RF power measurements are performed by an RTL-SDR, and a Python script handles all of the signal processing: tracking in the camera stream, computing the RF power, and generating an EMI heat-map. The principle of operation is shown in the schematic below:
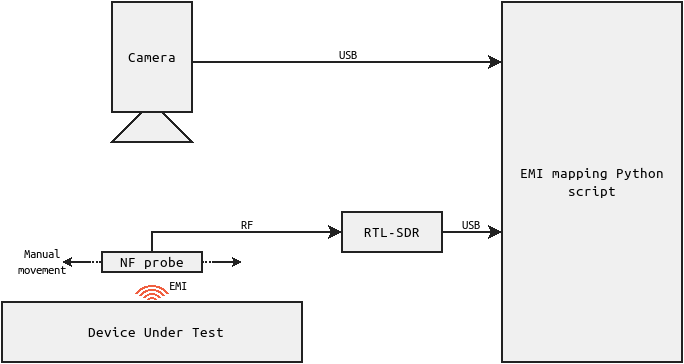 Schematic of the principle of operation of the machine vision technique
The Python code for this method was written in Python 3 using OpenCV (for image processing and tracking), pyrtlsdr (for the RTL-SDR wrapper interface), and various math and signal processing libraries.
Clip showing the tracking of the probe with the machine vision method. The area that has been mapped is highlighted in red.
Results
A short video demonstrating the scanning process of an Arduino Uno board performing analog readings and computation is shown below:
Output samples are shown below:
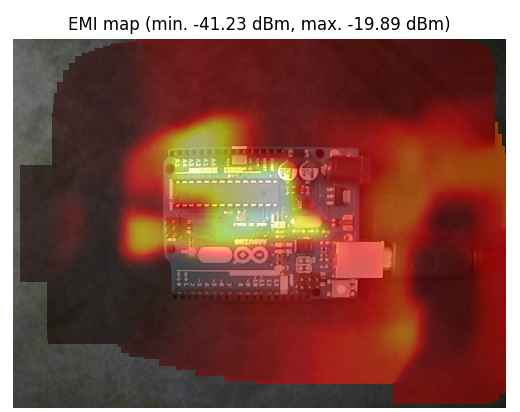 EMI scan of an Arduino Uno board (as shown in the video).
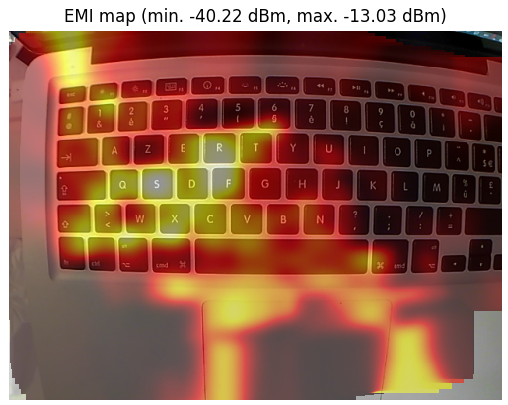 EMI scan of a MacBook laptop under heavy artificial CPU load.
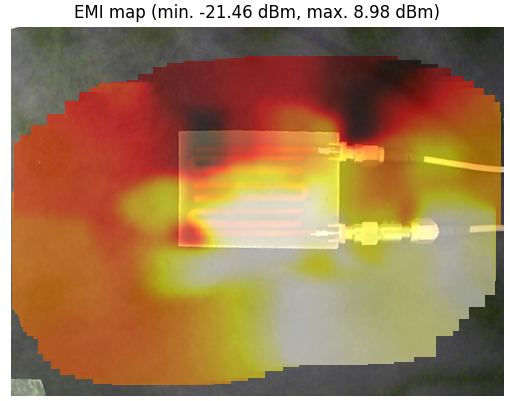 EMI scan of a hairpin RF filter (see article). A signal fully out of filter bandwidth is fed from the bottom SMA.
Advantages
- Simple and fast: the setup and measurements can be completed in as little as 5 minutes.
- High resolution: the physical size of the probe is the main limitation, but this can be mitigated through smart signal processing.
- Inexpensive: all the necessary hardware costs less than 15 USD, including a DIY near-field loop probe.
Limitations
- Repeatability: the main issue with this method is the handheld probe, which can lead to varying distances between the probe and the device under test. Using a jig to keep the probe at a known height can help mitigate this issue.
- Bandwidth: the RTL-SDR used in this method has a bandwidth of only 2MHz, but better SDRs can provide hundreds of MHz.
- Software: the current implementation of the code has some limitations, particularly with respect to probe tracking and signal processing. However, these issues can be addressed with additional investment in time and resources.
Download and usage
To download the Python scripts, visit my Github repository at https://github.com/CGrassin/EMI_mapper. The repository contains detailed instructions on the prerequisites, setup, and usage of the program. Please note that this is an early proof-of-concept program and may require some Python knowledge to use.
Conclusion
This open-source proof-of-concept program is an efficient method of creating 2D electromagnetic radiation heat-maps, despite its known limitations.
There is a vast potential for improvement with better signal processing, such as utilizing the I/Q samples to recover a wealth of information on the actual radiation, including harmonics, power distribution, phase, circuit states, surges, and 3D mapping.
With improved computer vision algorithms and graphical representations, this tool could provide engineers with a unique EMI/EMC insight.
Appendix: DIY H-field probe
My probe is a homemade antenna known as an H-field loop. While commercial near-field probe kits can be relatively expensive, it is easy to make one using a piece of semi-rigid coaxial cable with an SMA/SMB connector.
The schematic below illustrates how it can be built:

There are many resources available that provide additional information on how to make these antennas. For example, the article on interferencetechnology.com or the video on EEVBlog are great places to start.
The image below shows one of my DIY probes before I covered it with insulating tape:
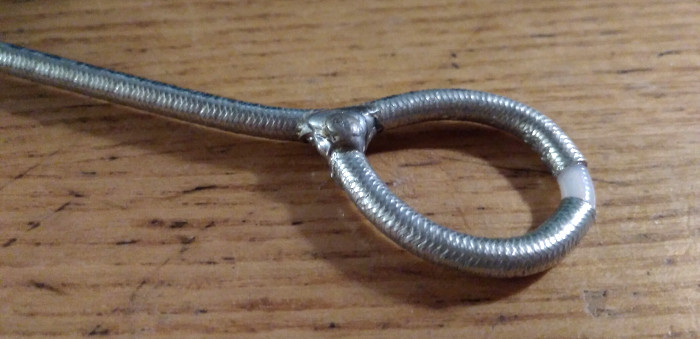
It is recommended to insulate the probe with heat-shrink or electrical tape to avoid shorting the device under test while probing.
In addition, I highly recommend placing a ferrite on the probe to prevent common-mode currents from flowing on the coaxial shield.
Author: Charles Grassin
What is on your mind?
Sorry, comments are temporarily disabled.
#1 Martin - G8JNJ
on April 30 2019, 12:08
#2 Author Charles
on May 1 2019, 23:03
#3 Alexandre
on May 3 2019, 8:22
#4 Author Charles
on May 5 2019, 0:51
#5 G8JNJ
on May 6 2019, 12:09
#6 John
on May 8 2019, 8:43
#7 Author Charles
on May 8 2019, 11:16
#8 Thor
on May 8 2019, 14:58
#9 Malik
on August 6 2020, 17:13
#10 Luxondes
on October 14 2020, 16:04