Beamforming/beamsteering principles and usage
Beamforming is a signal processing technique to get a directional signal transmission (or reception) from an array of emitters (or sensors). By controlling the relative phase and amplitude difference between the elements, we can shape the emission/reception pattern according to our needs.
This technique is often used with electromagnetic waves for antennas or with acoustic waves for sonar or biomedical applications, for instance.
The underlining physics principle being used here is the fact that, when several sources interact together, they have constructive or destructive interference depending on the direction. We can use these interference patterns to our advantage, to choose were most of the energy is sent. This figure shows the wave interaction pattern between two sources:
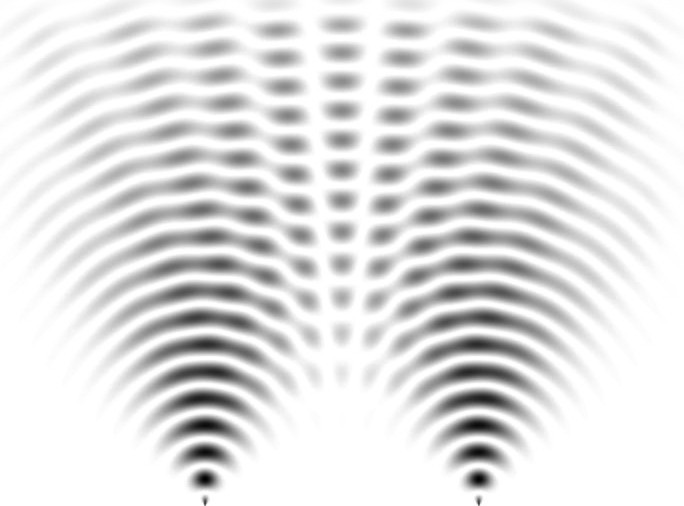 Simulation of the interference between 2 point sources, public domain.
By feeding each source with a signal of the same frequency but with a phase relationship (detailed later in this article), we can steer the beam without mechanically rotating the array.
 Animation showing the radiation pattern of a phased array, by Davidjessop, own work, CC BY-SA 4.0.
In my case, I wanted to explore this technique with sound. For experimentation purposes, there are numerous advantages on working with sound rather than electromagnetic waves. Namely, the very low frequencies (around 1 KHz) makes the electronics simpler to design and debug. Also, obviously, we are able to hear the result, which makes testing also much easier.
This project is about experimenting with acoustic beamforming and beamsteering, with an equally spaced linear array (ESLA) of 12 speakers, fed by signals we can control in amplitude and phase using an Arduino board. I will go into more details on the design, build and measurements.
Video
This video shows the project:
Design
Before building the array, we need to look at the equations to have a good understanding on the parameters and how they affect the resulting pattern.
Equations and parameters
Each element of the array is supposed to be an isotropic emitter, with an output signal:

Where "ω" is the angular speed, "a" is an amplitude factor and "Ψ" is the phase difference between successive elements due to two effects:
- an additional travel distance τ caused by the angle of the listener (θ),
- a phase offset φ that we add to change the beam steering angle.
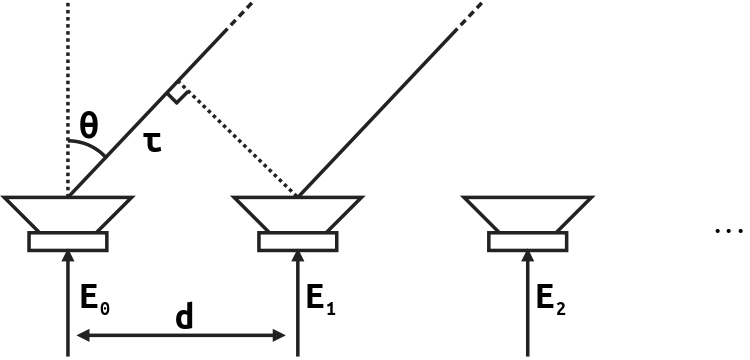
Mathematically, the expression of Ψ is:

We want to compute the emission diagram for the sum of elements (the "array factor"). Its expression is:

With a constant amplitude law (a(n)=1) and no phase offset (φ=0), the normalized magnitude of this sum is:

We can plot this function: x axis is the angle in radians, y axis is the relative amplitude.
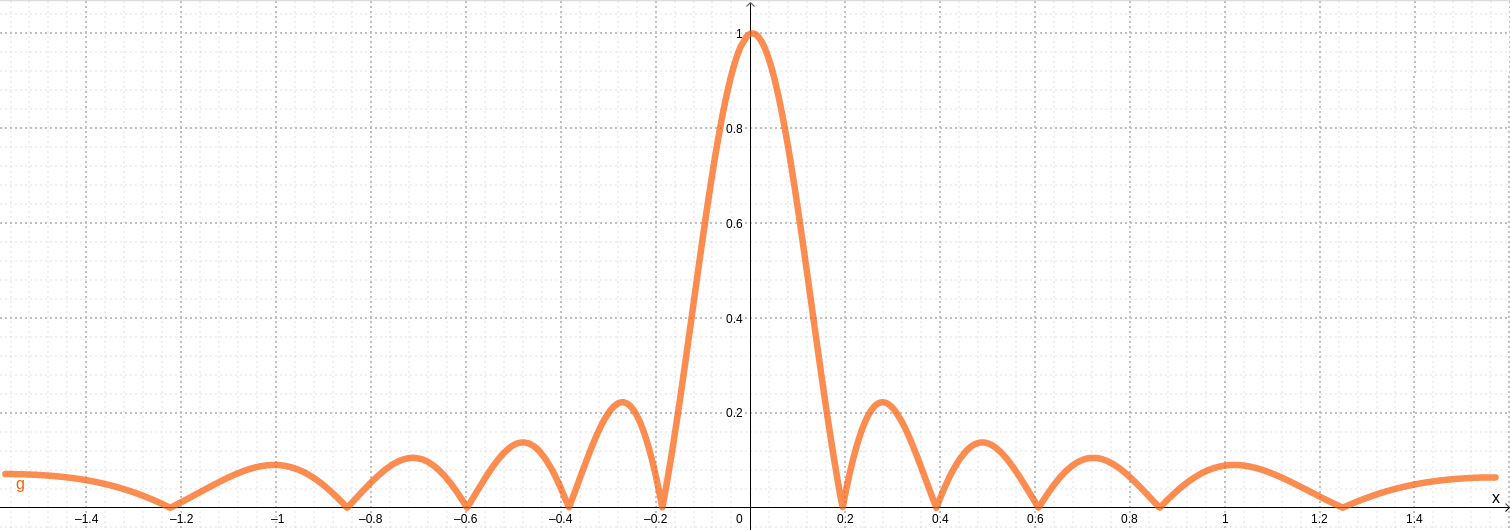
We see a main lobe where most of the energy is sent, and some side lobes which are often unwanted and considered parasitic.
These equations show the parameters we may tune to affect the shape of the beam:
- d, the spacing between the elements,
- λ, the wavelength of the input signal,
- N, the number of elements,
- The relative amplitude (a(n)) and phase laws (φ), more details underneath.
Remarkably, there is a relationship that sets the maximum distance d we may chose at a fixed frequency. To avoid "grating lobes", we want the following relation to hold:

The math gets more complicated when considering non-constant amplitude and phase laws. Hence, I wrote a Python pattern generator that I will be using throughout this project and article. For instance, the next graph hereunder was generated with the command:
python3 beamforming_pattern_gen.py --amplitude-law constant -f 750 -N 12 -d 0.15This script uses the complex form of these equations to solve the expression of the pattern as a function of θ.
Note: this demonstration is completely symmetrical for emission and transmission.
Relative phase law
As previously mentioned, the relative phase difference between the elements can be used to steer the beam. This means that we can "aim" the main lobe to an angle different than 0° (the direction normal to the array): up to -90° and 90°.
For instance, this is the pattern generated by a linear array of 12 elements spaced by 15 cm, with a signal frequency of 750 Hz, when there is no delta in phase (i.e all elements are fed with the exact same signal).
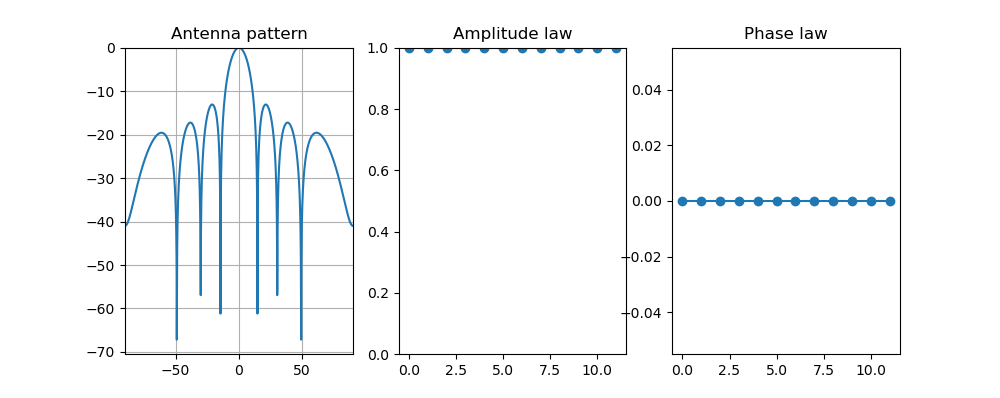
As expected, the peak is at 0°, directly in front of the array.
If we wish to change the angle of the main lobe, we need to add a phase offset φ. To steer it to an angle α, its expression is:
![$\varphi= \frac{2\pi}{\lambda}d\sin{\alpha} \text{ , for } \alpha\in \left [ -\frac{\pi}{2} ; \frac{\pi}{2} \right ]$](/projects/20200314_Acoustic_Beamforming/equation_steering.png)

This is the exact same array, but feeding a signal with a 60° degrees phase difference between each element and its neighbors.
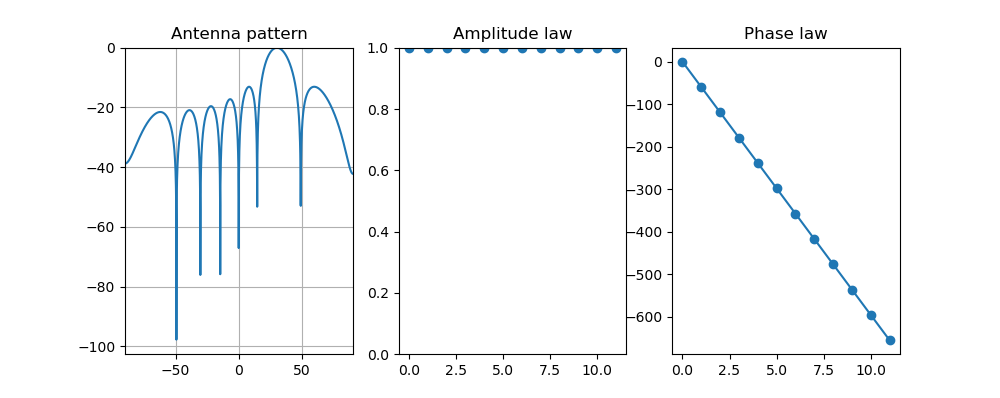
The array's main lobe is now at 30°: we steered it without mechanically moving anything.
This phase can be converted to a time delay with the formula:

Relative amplitude law
With every other parameter fixed, the maximum main lobe power is achieved when every element of the array emits their peak power, i.e. when a(n)=1.
The drawback is that the relative difference between main lobe and side lobe power is quite low: about 13 dB. We often want a better ratio, at the cost of some decrease in efficiency. This is an example where a second order polynomial amplitude law is being used:
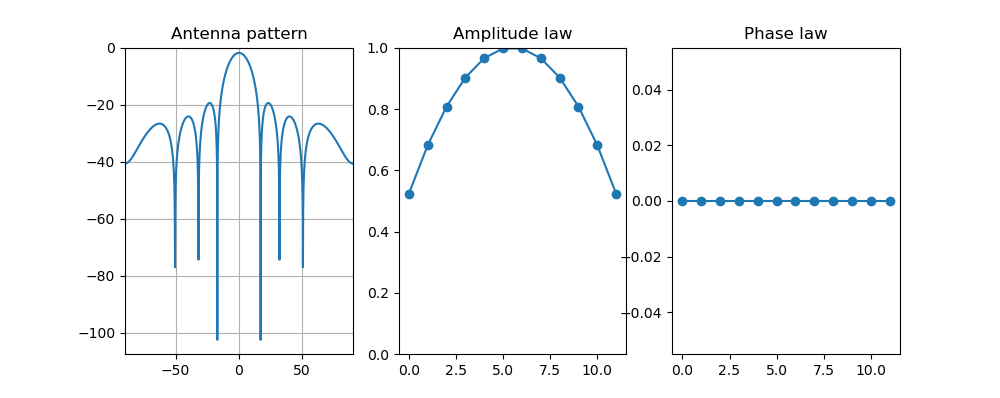
The difference is now about 17 dB, which is much better. However, we also lost 2 dB in the main lobe compared to the previous situation.
Build
This part describes the build process of my array: physical, electronics and code.
Physical
I built a linear array of 12 speakers. It was designed to transmit a 1000 Hz signal. To avoid the occurrence of grating lobes, they need to be spaced by 15 cm, according to the formula above.
This is a 3D model of one half of the array:
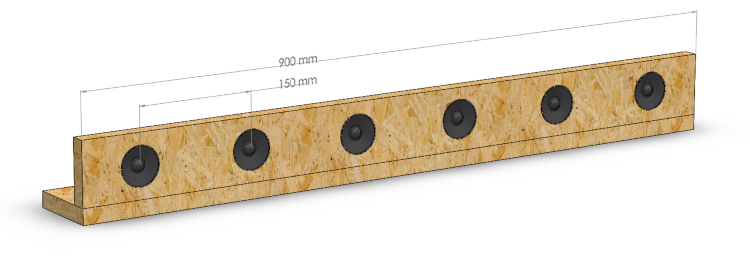
I made it into two parts of 6 speakers to make it easier to construct and transport. The structure was made out of agglomerated wood.
This is a photo of the completed and assembled array from the back side:
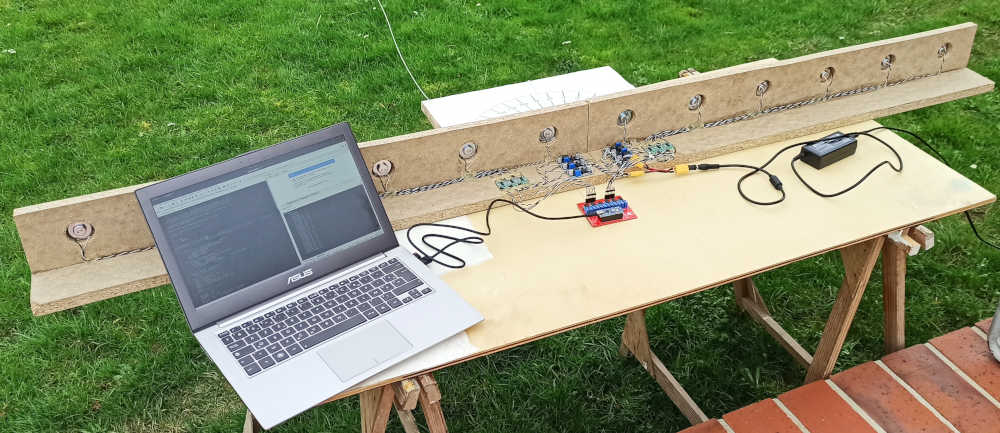
From this side, we can see the control electronics.
I also made a large protractor (may be seen in front of the array in the previous picture) to be able to measure the angle at which the sound level measurements are performed.
Electronics
The figure hereunder is a functional diagram for the electronics of this project:
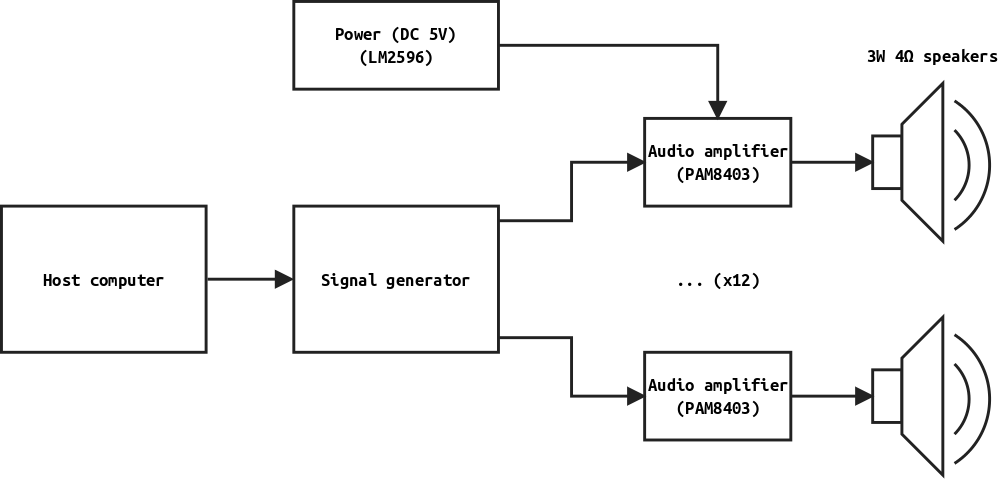
The most interesting part is the Signal Generator. This module is a PCB based around an Arduino Nano board. It contains 12 completely independent channels, with individual phase and amplitude control. I used the FM62429 2 channels digital potentiometer chip. This board is designed on the open-source EDA KiCad.
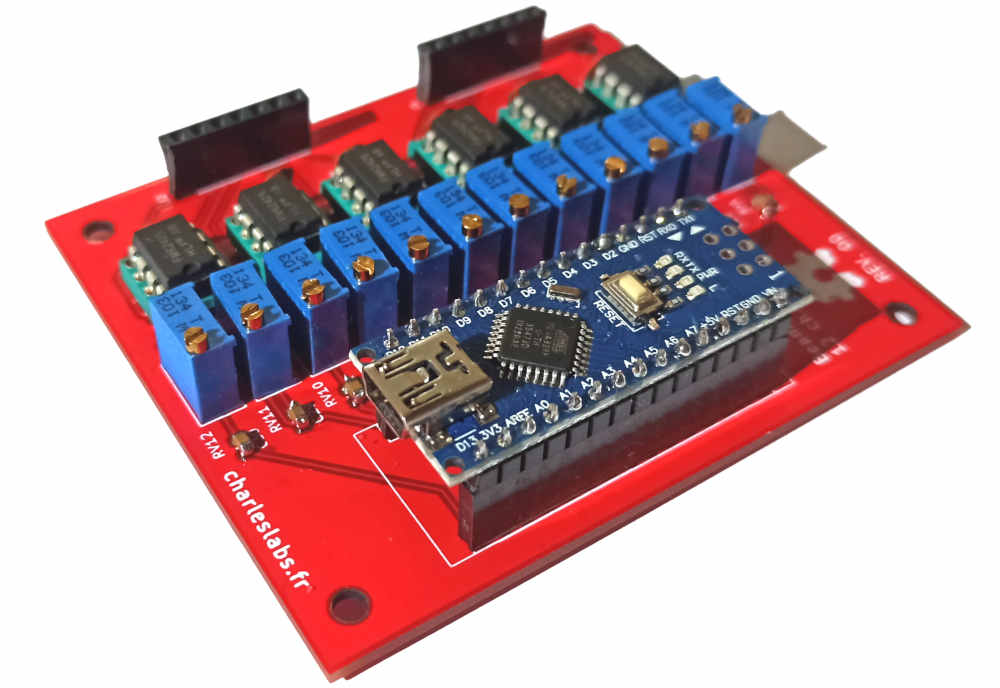
It was manufactured by the JLCPCB prototyping service. This photograph shows the completed and assembled PCB:
Because the signals are generated by digital pins of a microcontroller, they are square waves. The issue with this waveform is that it has a high content in harmonics, due to the discontinuities. I suspected that it might damage the speaker cones, and have an impact on the pattern. Hence, some additional low pass filtering smooths the square wave into a waveform closer to a true sine.
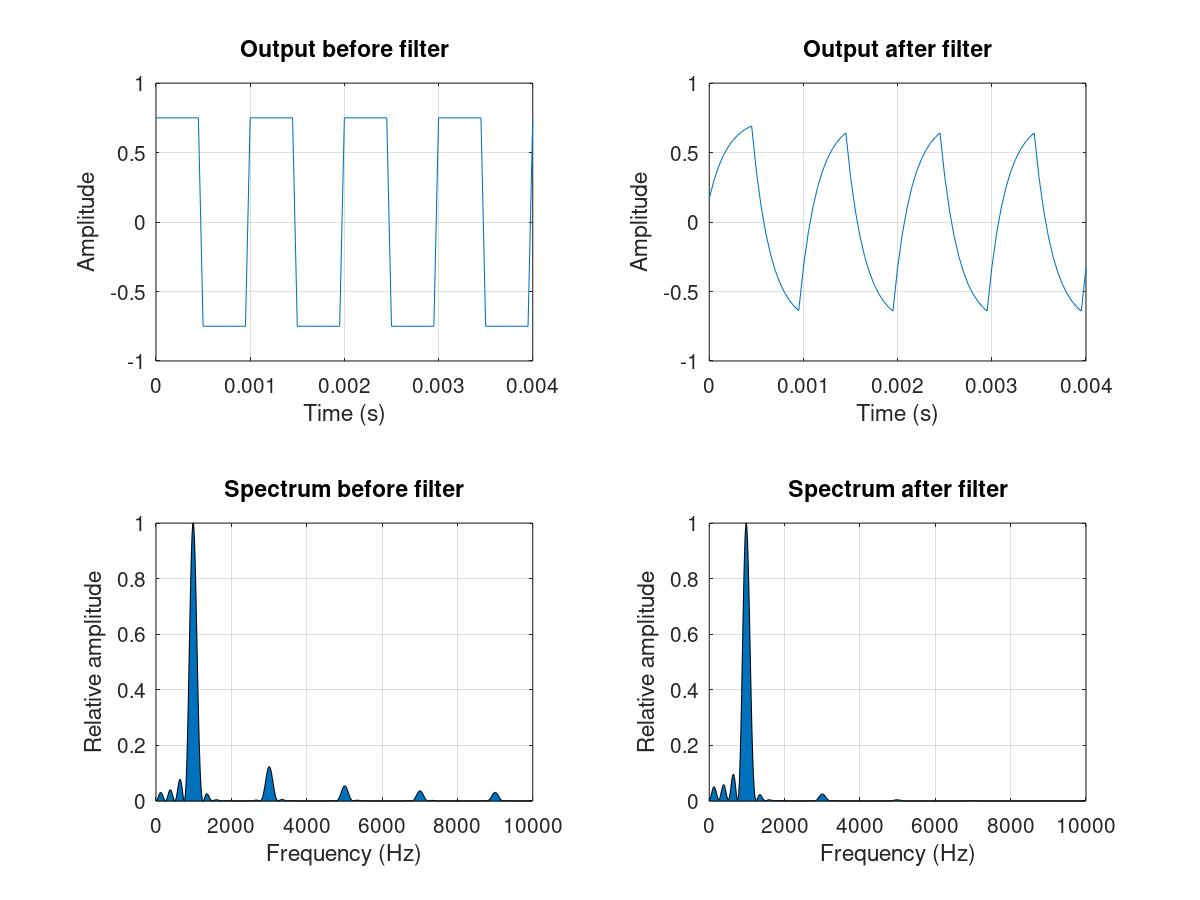
The FFT plots show how higher frequency harmonics get weaker after this first order filter (an RC filter).
To limit the cross-talk between the amplified speaker lines, the wire were twisted, which brought a very noticeable improvement. It also helps to keep everything tidier.
Code
Dynamically computing the phase offsets while generating 12 channels at about 1 KHz proved to be very challenging due to the low clock frequency of the Arduino Nano. My solution was to make a Python code that pre-computes the time scheduling of the pins toggles and generates Arduino code accordingly. Even then, I had use low level pin register operations to get the timing right and consistent.
For instance, using my script to generate code for signals at 1000 Hz with a 10° beam steering angle:
python3 beamforming_code_gen.py -f 1000 -a 10We can simply upload this code to the signal generator.
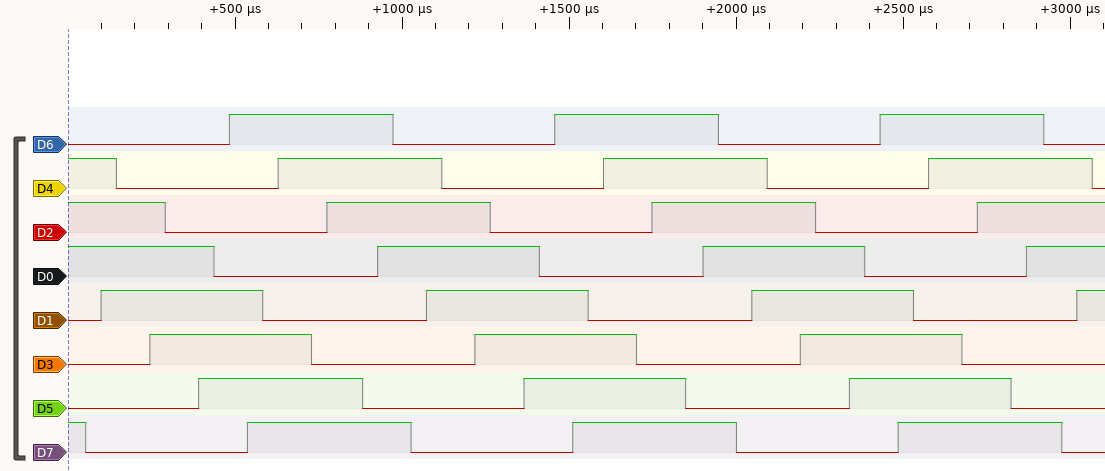
This PulseView capture shows the output of 8 channels of the signal generation with a logic analyzer (24MHz, 8CH), when the beam is steered to +20°.
Similarly, this capture shows the output when the beam is steered to +75°.
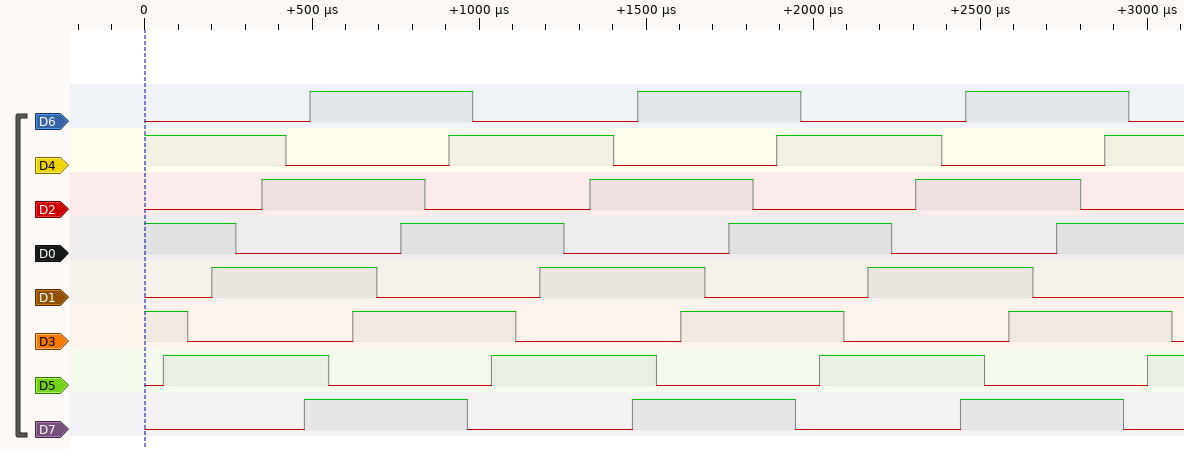
In these screenshots, we clearly see the effect of the phase difference. I used this tool to make sure my signal generation works properly, and that there were no timing glitches.
Measurements
My final measurements were done in an open field to minimize the effect of parasitic reflections. I took a long enough string to be in the far-field, and measured the angle using my protractor.
The "Spectroid" Android app was used to get the relative acoustic level measurements.
I took as many samples as I could to be able to later process the data to filter out the outliers. The key source of error is the acoustic noise, mostly caused by wind.
Experiment 1: constant amplitude and phase
For the first experiment, the signal generation has the following parameters:
- Frequency = 750 Hz
- Beam steering angle = 0° (no phase offset)
- Constant amplitude
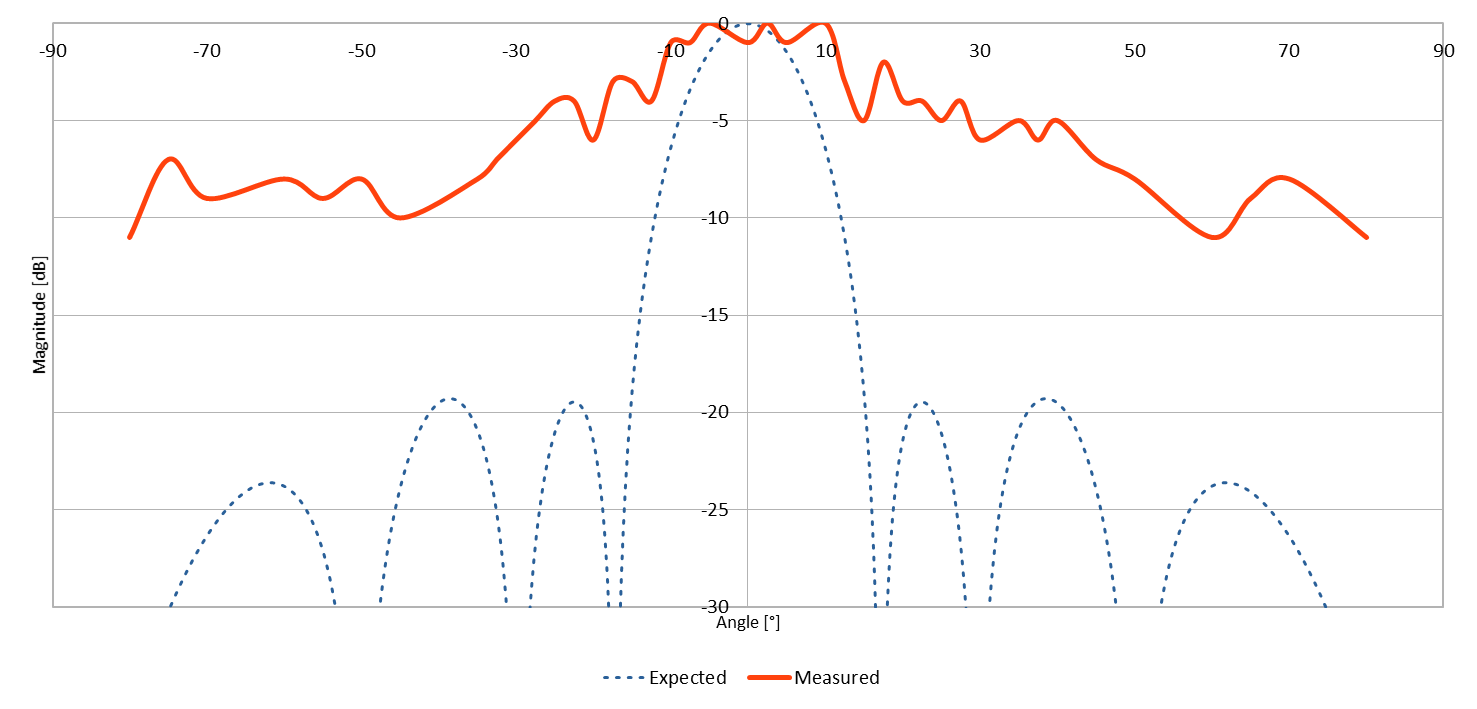
This is the measured pattern, compared to what was expected (according to my simulator):
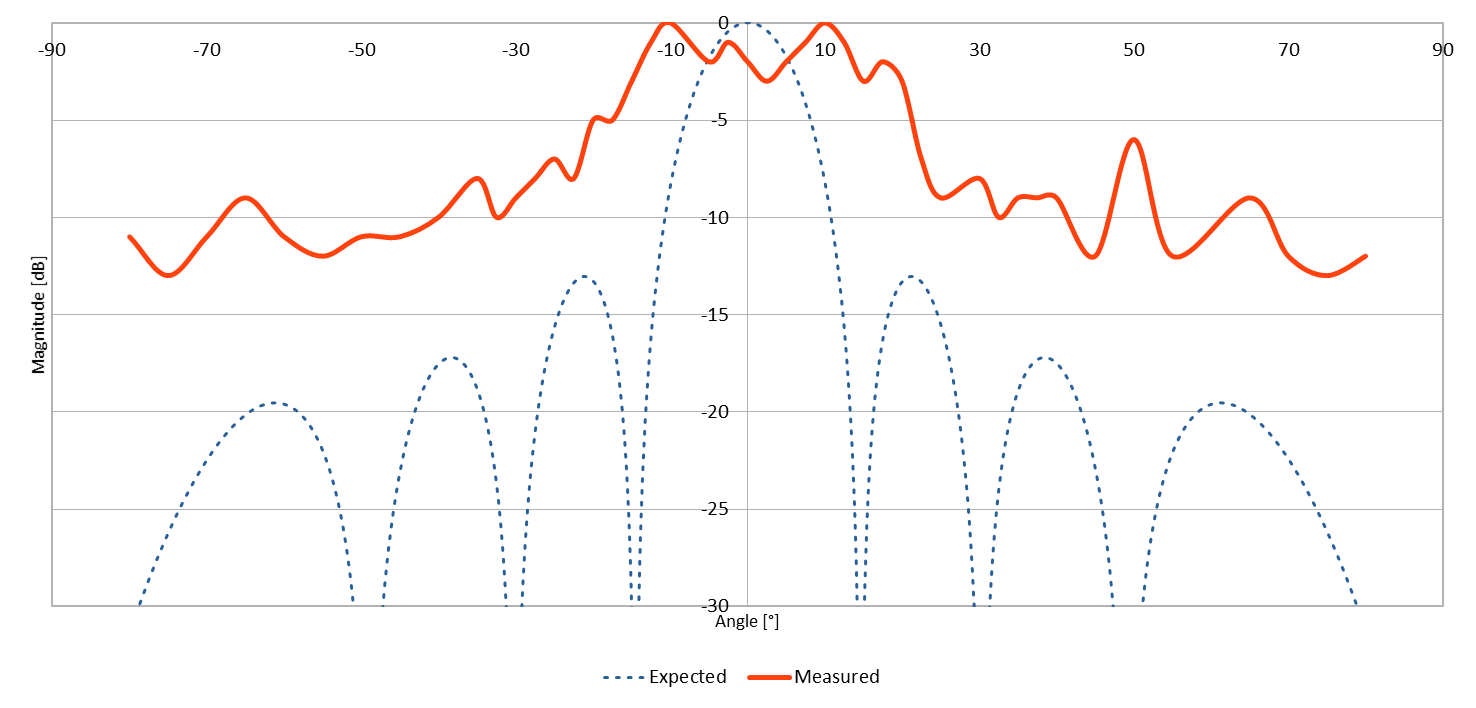
The general shape matches with the expectations. However, the main lobe is wider and the side lobes average level is a lot higher than the computation. There are several hypothesizes to explain this:
- The noise has significantly more impact on the lower levels of the side lobes,
- There are some interactions with the environment (reflections),
- The back-plane holding the speakers is not completely isolated from them, and transferred some mechanical energy.
Experiment 2: phase law (30°) and constant amplitude
For the second experiment, the signal has the following characteristics:
- Frequency = 750 Hz
- Beam steering angle = 30°
- Constant amplitude
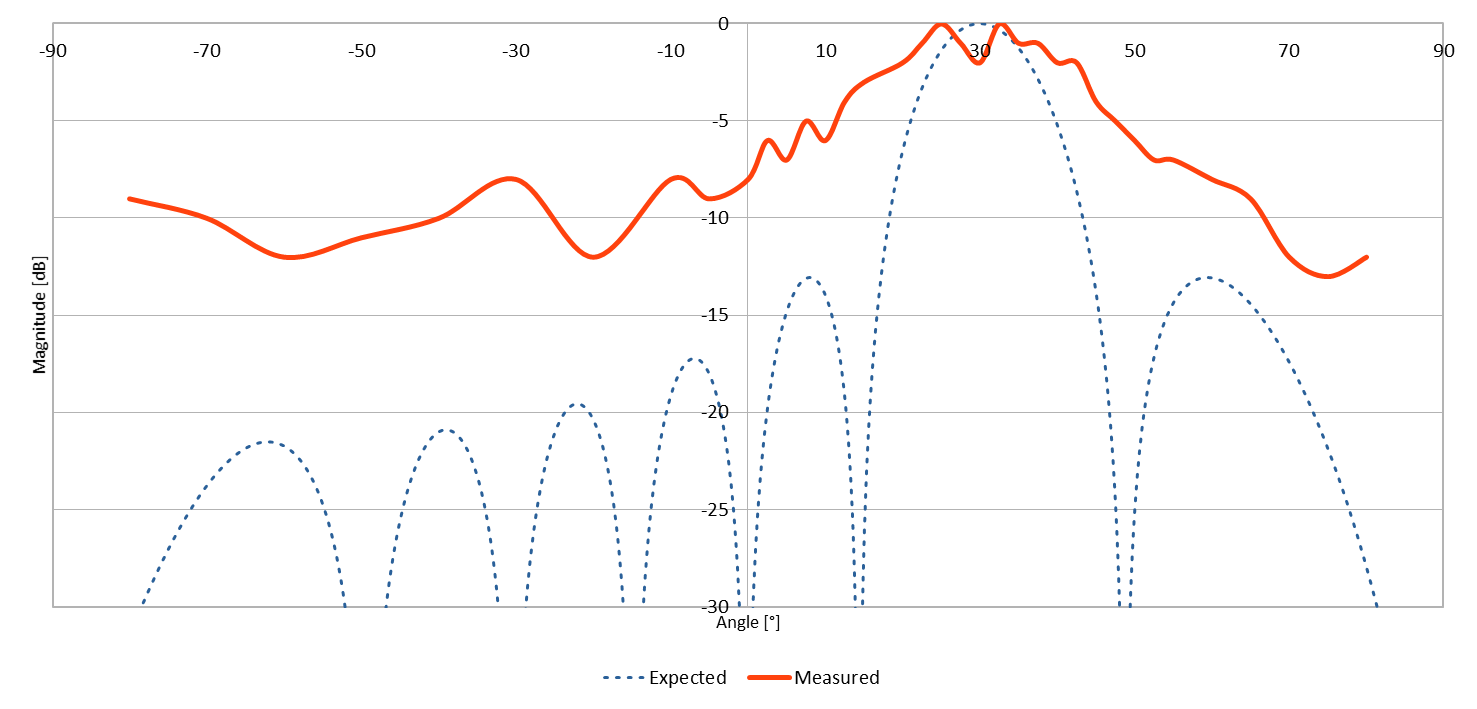
This pattern looks like the previous one, but the beamsteering effect is very noticeable and the center of the main lobe is were it was expected.
Experiment 3: log-linear amplitude law and constant phase
For the last experiment, the signal has the following characteristics:
- Frequency = 750 Hz
- Beam steering angle = 0° (no phase offset)
- Log-linear amplitude law (-1dB between each element and the next one, from the center)
Interestingly, this pattern shows the opposite of what we expected: compared to the result of the first experiment, the ratio between the signal level in the main lobe and side lobes is actually worst than with the constant amplitude law! The most likely reason is that the absolute output level dropped due to the lower excitation of the elements. Therefore, the signal-to-noise ratio of my measurement decreased. This has more impact on the side lobes because their level is already quite low.
Conclusion
My linear phased array was built using 12 speakers and some custom electronics for signal generation. The beamforming and beamsteering effects are very noticeable in the measurements I have done.
For these experiments, I only used a single frequency sound, as close as possible to a pure sine wave. Making it work with a more complex sound such as music would require an additional digital signal processing stage.
All of my code, design and measurement data is published under MIT license on my GitHub: https://github.com/CGrassin/acoustic_beamforming
There is another technique to get a much more dramatic directionnal sound signal that works on a completely different principle. It is known as Sound from ultrasound and is often refered as "Sound Lasers". It uses frequency modulation to transmit the sound with a ultrasound carrier frequency. The air is a nonlinear medium and demodulates the sound. With a 10 cm speaker, the effect is astonishing with only a few degres of dispersion. However, unfortunately, there are some very valid safety concerns due to the very high output power of those systems.
Bibligraphy
- Leandro de Santana. Fundamentals of Acoustic Beamforming, from https://www.sto.nato.int/publications/STO%20Educational%20Notes/STO-EN-AVT-287/EN-AVT-287-04.pdf
- Amaro Da Silva Gaviola, Amaro Da Silva Gaviola and Hendra Kusuma (2018, March). Audio beam steering with phased array method using Arduino Due Microcontroller, from https://www.researchgate.net/publication/324956381
- Prof. Sean Victor Hum. Antenna Arrays, from http://www.waves.utoronto.ca/prof/svhum/ece422/notes/15-arrays2.pdf
- Phased Array Antennas, from https://www.tutorialspoint.com/radar_systems/radar_systems_phased_array_antennas.htm
Auteur : Charles Grassin
What is on your mind?
Sorry, comments are temporarily disabled.
#1 Tijn Jeletich
on May 10 2023, 15:09
#2 Author Charles
on May 10 2023, 21:14
#3 uremmel
on July 5 2023, 22:19
#4 Author Charles
on July 6 2023, 11:06
#5 Raj
on August 27 2023, 10:20
#6 uremmel
on January 22 2024, 23:12
#7 DavidT
on April 9 2024, 12:38
#8 Aravind
on June 30 2025, 12:40
#9 Aravind
on June 30 2025, 12:41
#10 Aravind
on June 30 2025, 12:42
#11 Aravind
on June 30 2025, 12:42